 Office > Excel > Excel 2019 > Content
How to generate multiple reports from one pivot table(auto create monthly report,hyperlink in excel)
In excel, you can use PivotTable to automatically generate a paginated report from a table consisting of multiple months, multiple departments, or multiple categories, that is, split the data for each month, department, or category into a table. To achieve this, you can use the "Show Report Filter Pages and Filters" in the excel PivotTable. The "Show Report Filter Pages" is often grayed out, it is usually for two reasons, on the one hand, the field that generates the paging report form is missing, on the other hand, you have chosen one more when creating a PivotTable.
In addition to generating pagination reports, excel PivotTable can also synthesize daily report into monthly report, which can be implemented with combined functions. The combination function can also synthesize the monthly report into the annual report or the quarterly report, and combine the minute report into the hour report.
I, The "Show Report Filter Pages" in excel PivotTable is gray for two reasons
(I) Reason 1: Did not drag the field to the "Filters"
1. Select one of the cells in the PivotTable, such as A3, select the "Analyze" tab, click "Options" on the "PivotTable" in the upper left corner of the screen, and the "Show Report Filter Pages" is gray in the pop-up menu. Drag a field(such as "City") to the "Filters"(method: move the mouse to the "department" and hold down the left button, then drag to the "filter", release the left button, when a bold green line appears; click "Options" in the upper left corner of the screen again, "Show Report Filter Pages" is already available; the operation steps are as shown in Figure 1:
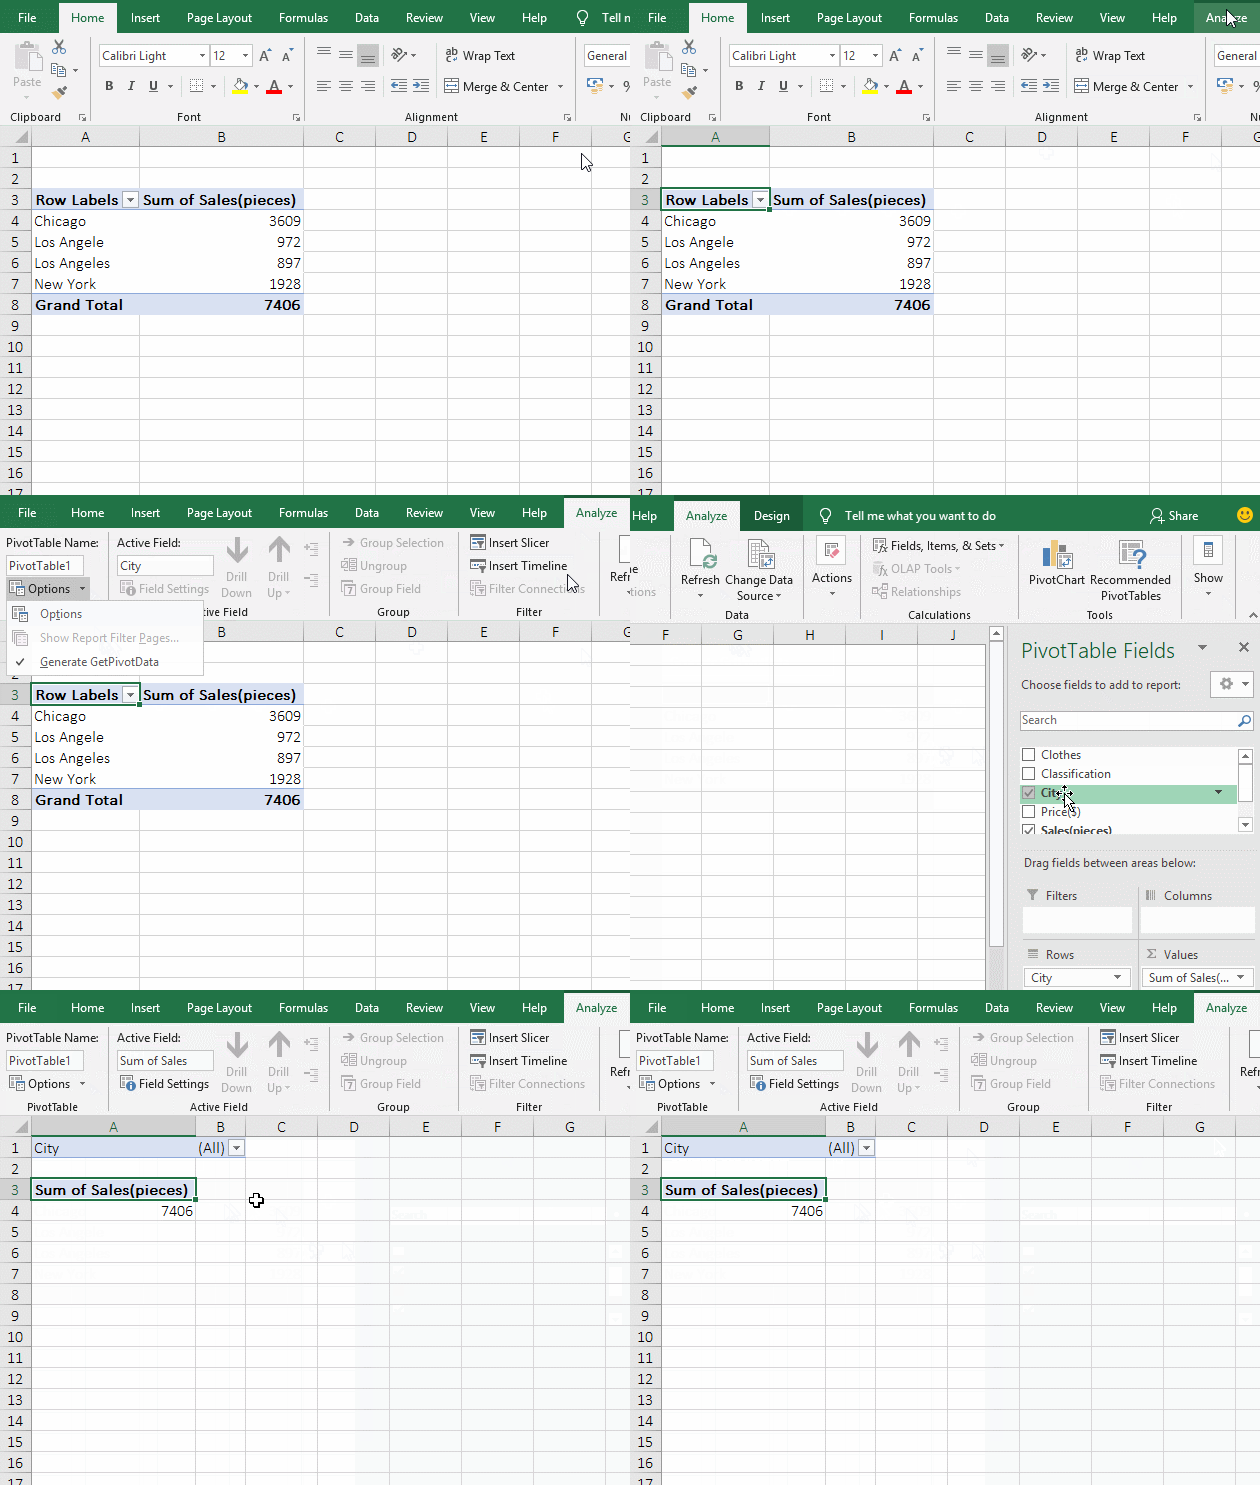
Figure 1
2. Automatically generate a pagination report form must specify what field to use, that is, to specify what field to split the table, if the field is not specified, the "Show Report Filter Pages" is gray.
(II) Reason 2: When creating a PivotTable, check "Add this data to the Data Model"
1. Create a PivotTable. Select one of the cells of the table in which you want to create the PivotTable, select the "Insert" tab, click "PivotTable" in the upper left corner of the screen, open the "Create PivotTable" dialog, and check "Add this data to the Data Model", click OK to create a pivot table in the new worksheet and automatically select the "Analyze" tab.
2. Reason for verification. Click "Options" in the top left of the screen, "Show Report Filter Pages" is gray in the expanded menu; click the "Clothes and City" fields to check them, drag the "City" to "Filters",Click "Options" in the top left of the "screen" again , "Show Report Filter Pages" is still gray, indicating that "Add this data to the Data Model" is checked when creating the PivotTable causes a result which paging report form still cannot be generated with the generate Paging Report field(compared with "Reason 1"); operation process steps, see screenshot in Figure 2:
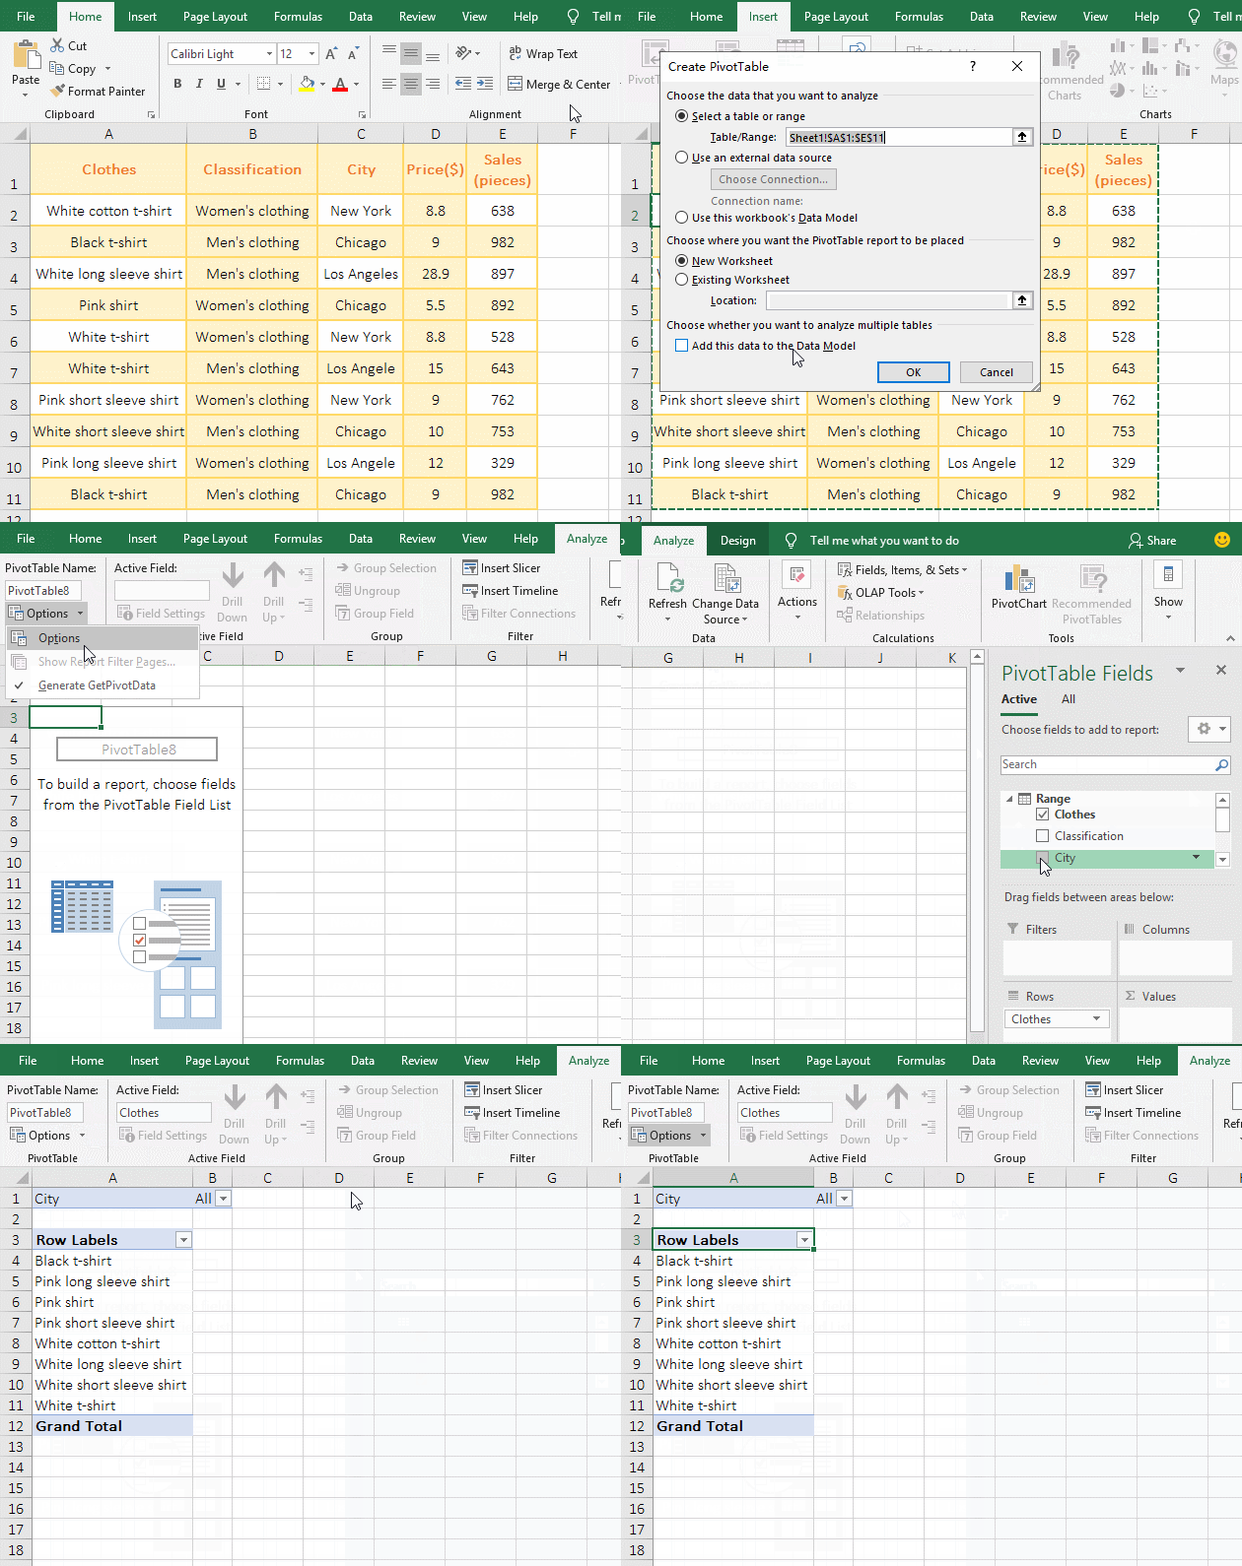
Figure 2
Tip: If it is Excel 2007, "Show Report Filter Pages" is in the "Options" of the "PivotTable" on the "Options" tab; uses Excel 2019 in the above demo, "Show Report Filter Pages" is in the "Options" of the "PivotTable" in the "Analyze" option.
II, How to generate multiple reports from one pivot table(Automatically create page reports from a pivot table)
(1) Automatically generate monthly paged reports form
If you want to automatically generate a pagination reports form on a clothing sales pivot table. Click one of the cells in the table (such as B6), move the mouse to the field "Month", hold down the left button and drag to the "Filters", after a bold green line appears, release the left button, then "Month" is added to the "Filters"; select the "Analyze" tab, click "Options" in the top left of the screen, select "Show Report Filter Pages" in the pop-up menu, open the "Show Report Filter Pages" dialog, select "Month", click "OK", it will automatically generate multiple page reports from April to September, each page has the same field as the original PivotTable; the operation process steps, as shown in Figure 3:
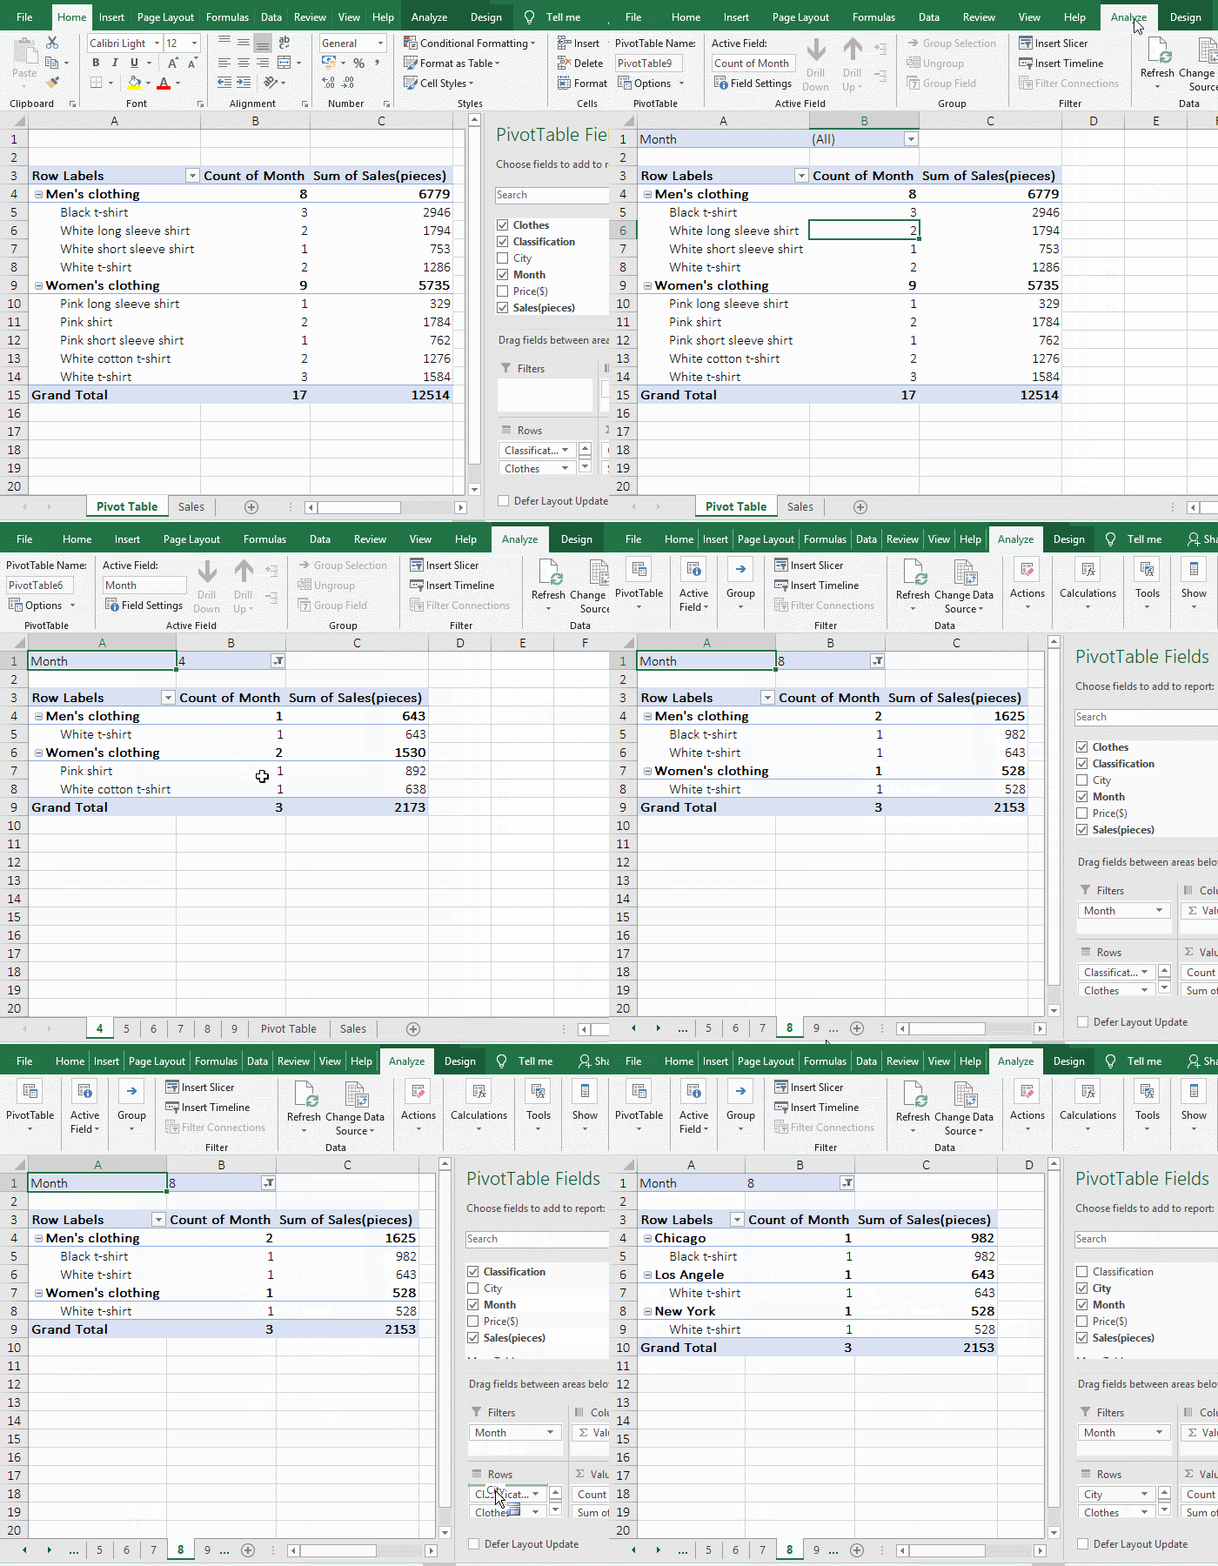
Figure 3
(2) Automatically generate multiple paged reports form by "Department"
1. If you want to automatically generate multiple paged reports form by "Department" from an employee salary PivotTable. Select any cell in the table (such as A3), drag the "Department" to the "Filters", click "Options" in the upper top of the screen, select the "Analyze" tab, and select "Show Report Filter Pages" in the expand menu, Open the "Show report filter pages" dialog, select "Department", click "Ok", then automatically generate the "Administration Department, Finance and Technology Department" page reports form; the operation process steps, see screenshot in Figure 4:
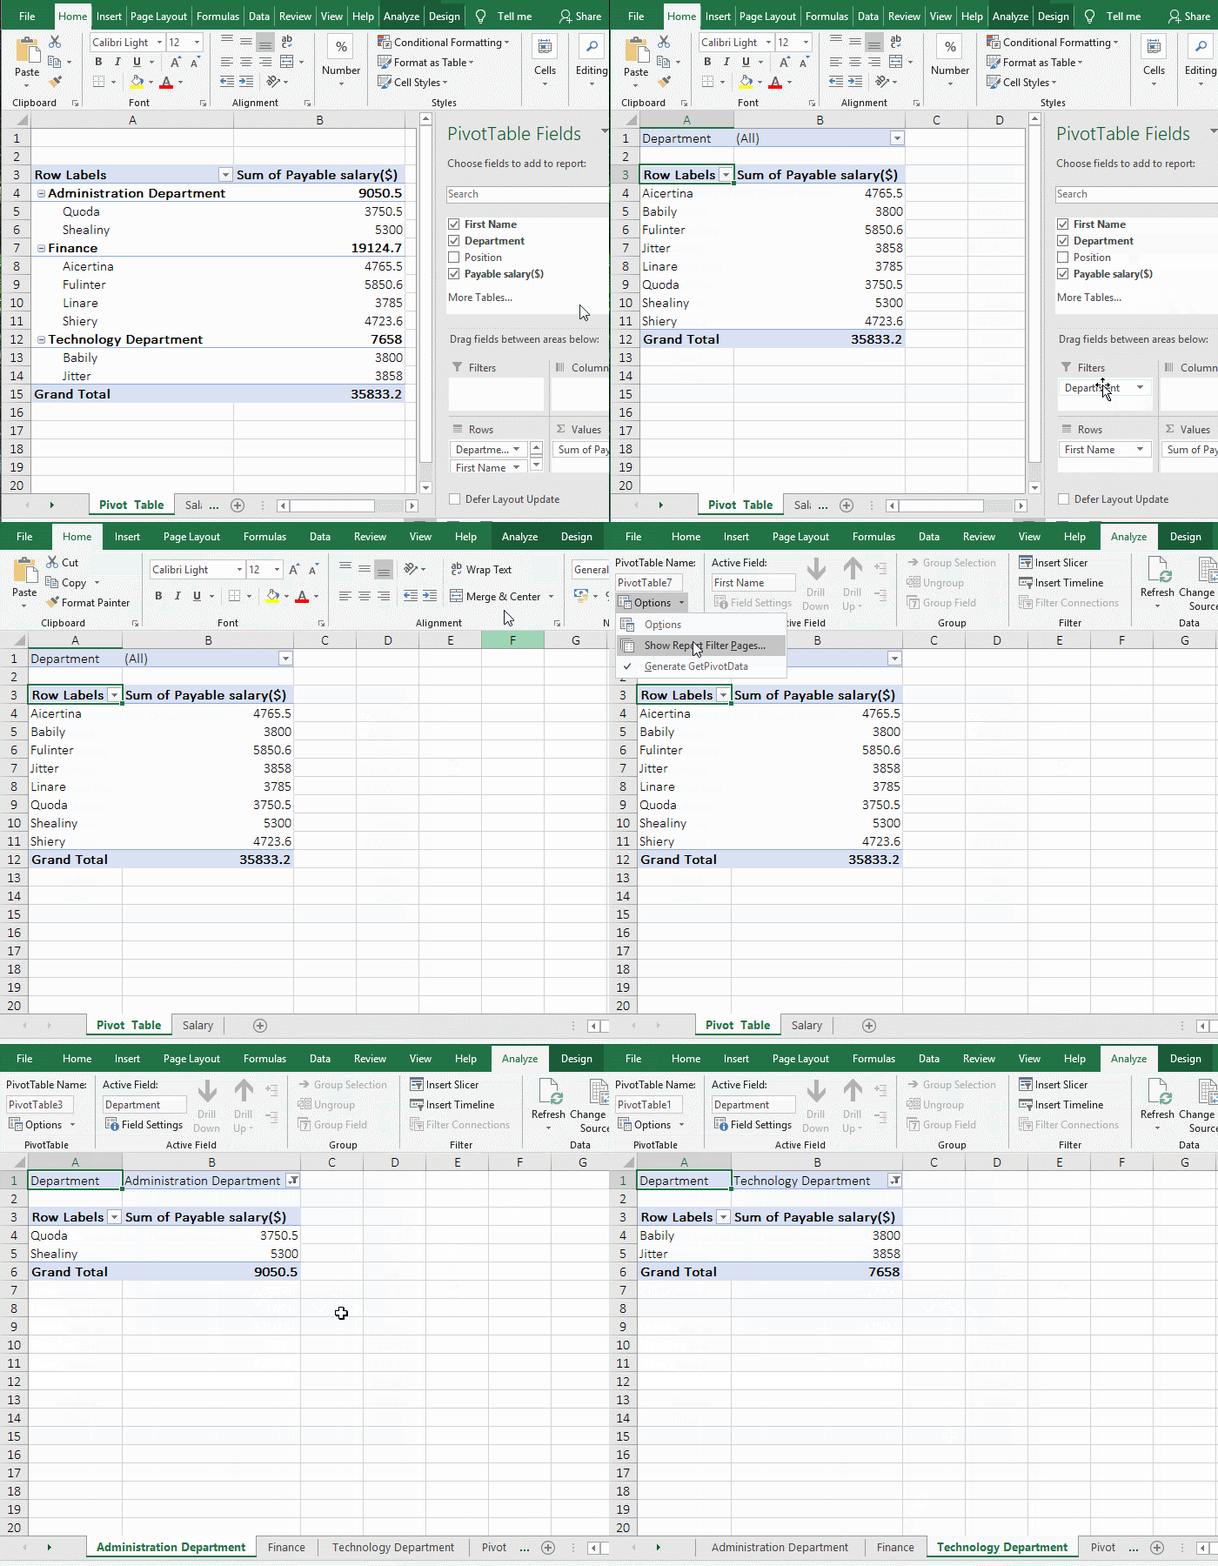
Figure 4
2. Open the "Show Report Filter Pages" dialog, you can also use the shortcut keys Alt + J + T + T + P, the key method is: hold down Alt and press J, T, T and P one time.
After the page reports form is generated, if the source table data is modified to be updated to the page reports form, the update method is the same as the data to be modifyed and updated to the pivot table. For details, please refer to the article "How to create a pivot table in excel(15 examples, with distinct count, percentage and four areas)".
III, Daily Report Synthesis Monthly Report with Excel PivotTable
1. Create a pivot table for a daily report form. Select a cell of the daily report form, such as A2, select the "Insert" tab, click "PivotTable" in the top left of the screen, open the "Create PivotTable" dialog, keep the default options, click "OK", then successfully created the pivot table for a daily report.
2. Synthesize monthly report form into daily report form. Check the field "Date and Turnover", select a cell in the data area of the table, such as A4, select the "Analyze" tab, click the "Group Selection" in "Group", open the "Grouping" dialog, only select "Months and Years" in the "By" list, click "OK", then combine the daily report form into a monthly report form, and count the monthly turnover; the operation process steps, as shown in Figure 5:
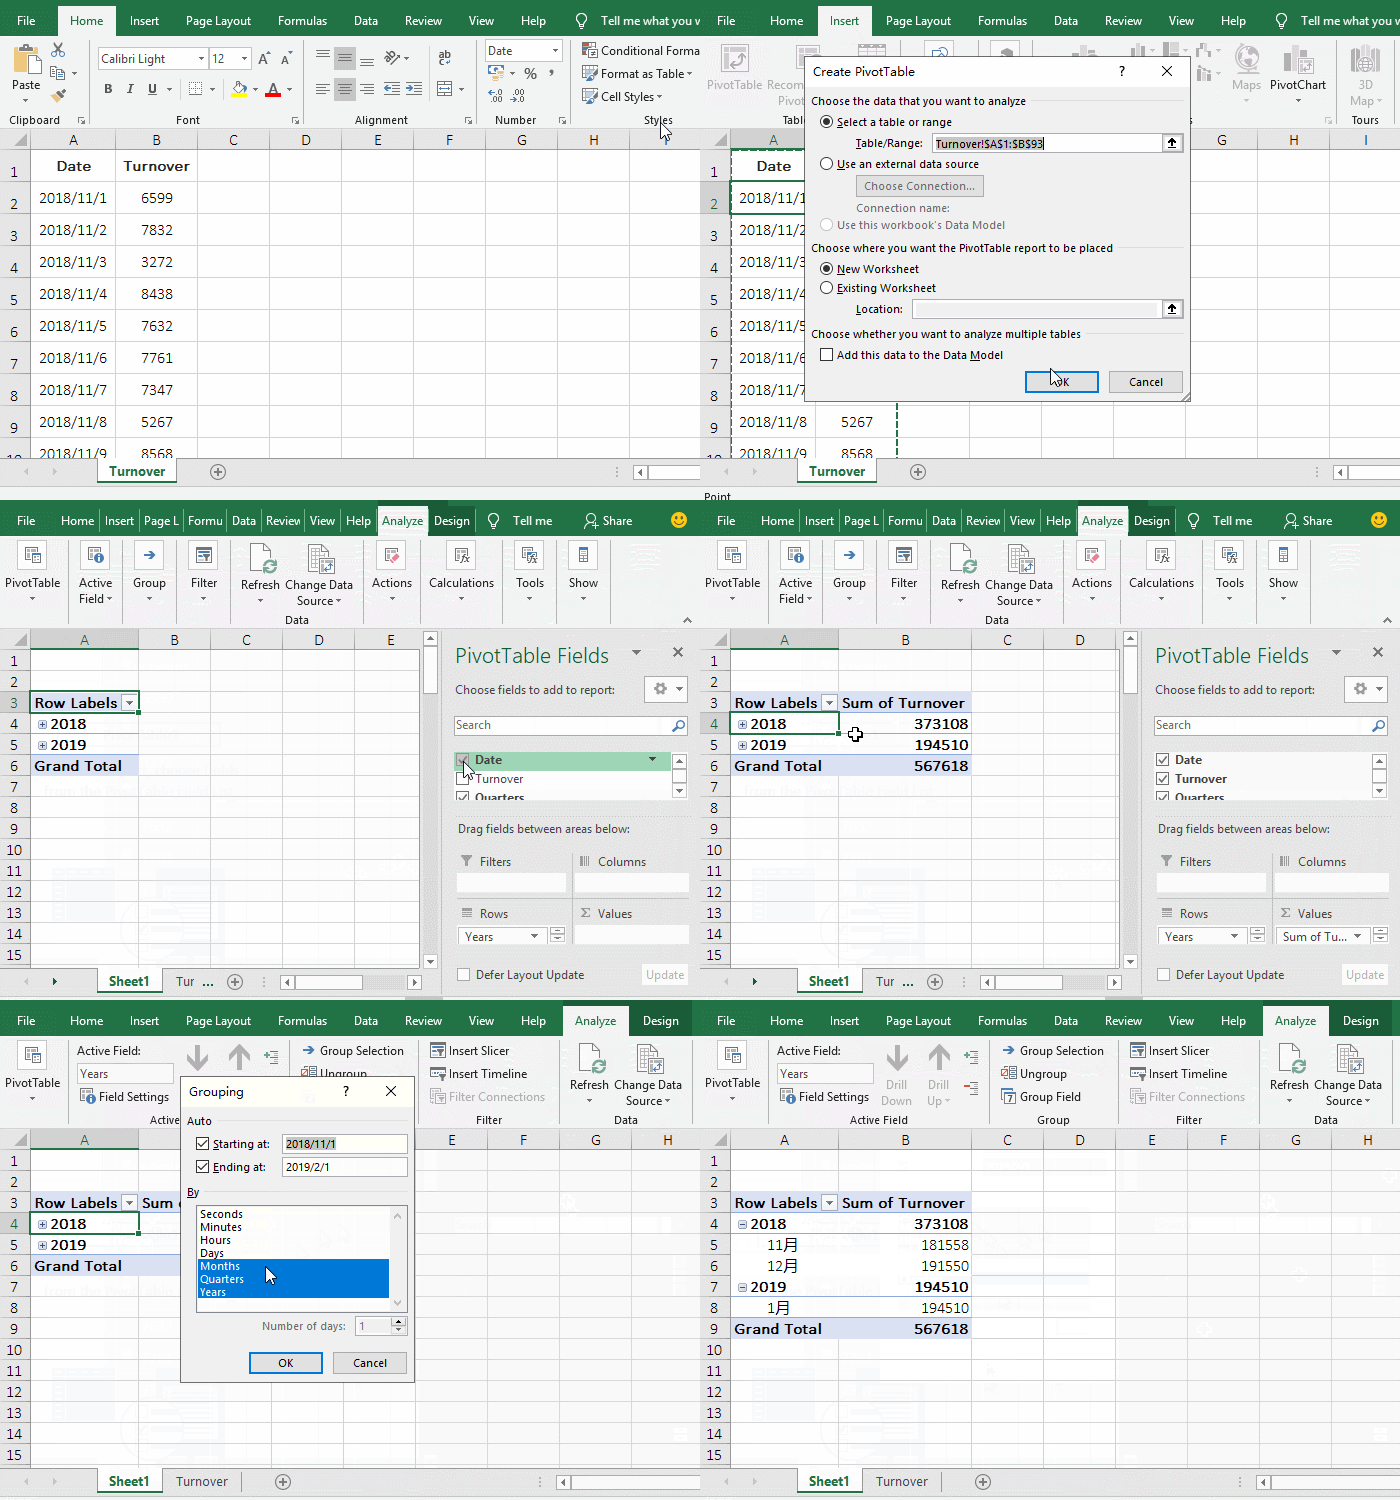
Figure 5
Tip: You must select one of the cells in the data area of table, the "Group Selection" is changed from gray to optional; the column heading (such as A3 or B3) is selected, and the "Group Selection" is still grayed out. In addition, the "Date" field is checked, and the "Quarter" field is automatically displayed by default. If you do not want to display it, the "Quarter" field is not checked.
3. In the "Grouping" dialog, the "By" list have year, quarter, month, day, hour, minute, second, you usually choose two or more than the minimum unit to be counted; for example, in the demo, to count "month" for the Turnover, just select the "Year" of the previous unit of "Month" and "Month"; and if you want to display the "minutes", usually select "hours and minutes".
IV, Excel deletes all page reports form at once
1. If you want to delete the page reports from April to September. Select the page report form "4", hold down Shift, click the page report form "9", select all the page reports, right-click one of the page reports form, and select "Delete" in the pop-up menu, pop up a dailog asking whether to permanently delete the selected worksheet. Click "Delete", the page reports from April to September will be deleted at one time; the operation process steps are as shown in Figure 6:
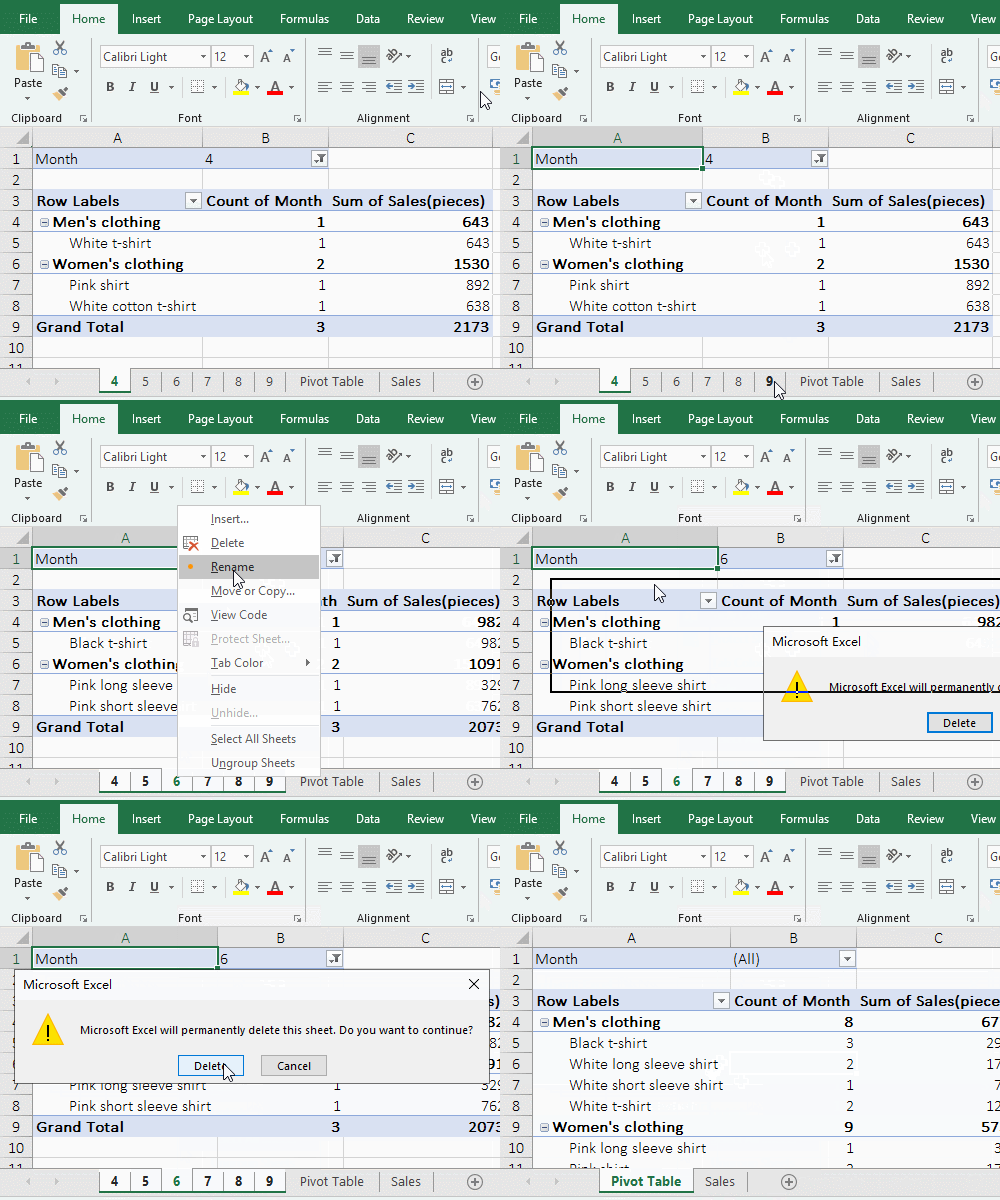
Figure 6
2. If the labels of the page reports form are not continuous, select one, press and hold Alt, and then click the page report form to be selected one by one, you can select them all.
Tip: You cannot delete a paginated report form, so be sure to delete it before deleting it.
V, How to create hyperlink in excel for the page report form in excel
1. Add "next page" navigation. If you want to add "Next Page" navigation to page report 4; copy "Next Page" to the cell where you want to add navigation(such as C11), click the "Center" icon in the "Home" tab to center it, press Ctrl + K to open the "Edit Hyperlink" dialog, select "Place in This Document" under "Link to" on the left, then select '5' under "Cell Reference" on the right, click "OK", then give "Next Page" adds a hyperlink to the page report form 5; click the underlined "U" icon(or press Ctrl + U) to remove the underline of the "Next Page" and click "Next Page" to navigate to the page report form 5; the operation process steps, see screenshot in Figure 7:
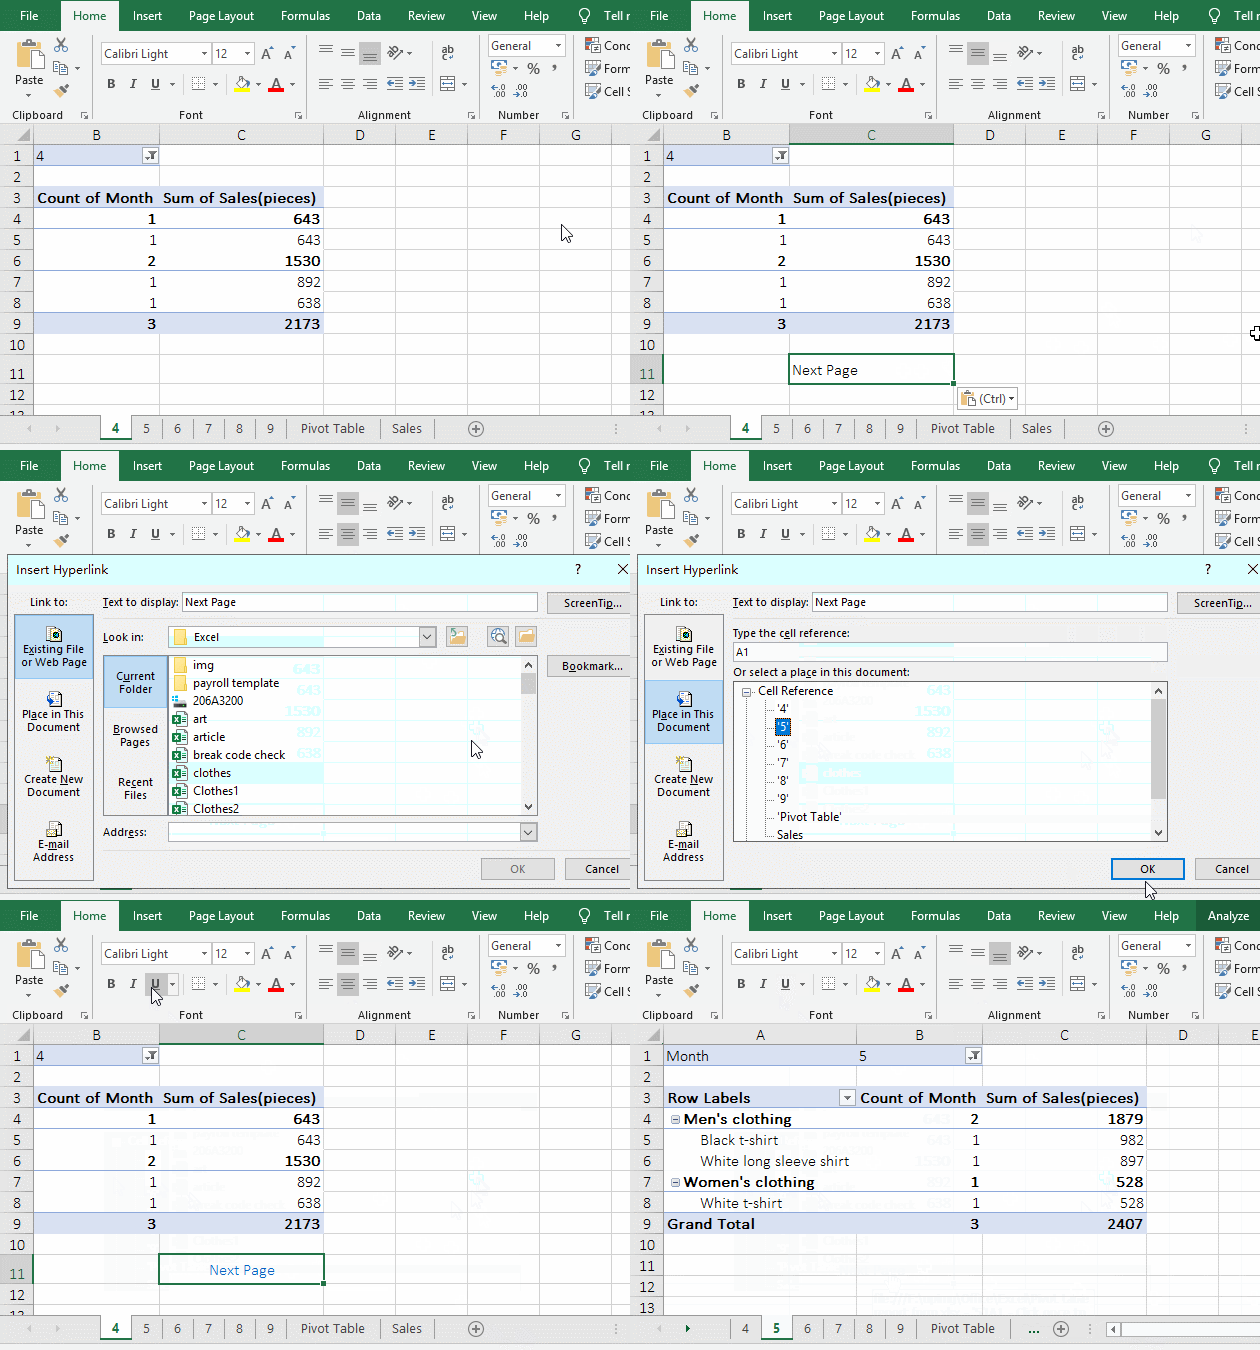
Figure 7
2. Add "previous page" navigation. The method is the same as adding the "next page" navigation, except that when adding a hyperlink to the text "previous page", the previous page report form of the current page report form is selected. For example, add "Previous Page" navigation for "page report form 5", select "4" when adding a hyperlink to "Previous Page".