 Office > Excel > Excel 2019 > Content
Eexcel subtotal by year, month and week with Pivot Table and Formula, and extract results of subtota
It is easier and more convenient to subtotal with the PivotTable by year, month, day and week in Excel, it can return their results of subtotal with a simple setup; you subtotal by year, month and day, they can be displayed directly in the results of subtotal, but by week, the week can only be represented by a date; you subtotal with the formula can convert the date that belongs to the week into the first few weeks.
Use formulas to subtotal by year, month and week, mainly use the functions such as Sum, SumIfs, SumProduct, Value, WeekNum, Date, Row and Text, for example, subtotal by year and month with the first four functions, and subtotal by week is more complicated, it needs to be implemented with Sum(or SumProduct) + Value + WeekNum + Row.
I, Excel subtotal with PivotTable(How to add subtotals in excel pivot table)
(I) Subtotal by year and month
1. Create a PivotTable. Select one of the cells in the table, select the "Insert" tab, click "PivotTable" in the top left of the screen, open the "Create PivotTable" dialog box, keep the default settings, click "OK", then it creates a PivotTable in the new worksheet; check the fields "Clothes, Date and Turnover" and it has automatically subtotaled the Turnover of each garment by "Year"; the operation steps are as shown in Figure 1:
Figure 1
2. Subtotal by month. Select one of the cells whose texts are years(such as A5), select the "Analysis" tab, click "Group Selection", open the "Grouping" dialog box, "Step" select only "Year and Month"(click "Quarter" deselect), click "OK", the Turnover of each garment is subtotaled by year and month; if the year is to be displayed to the column, drag "year" from "Rows" to "Columns" list box; operation process steps, see screenshot in Figure 2:
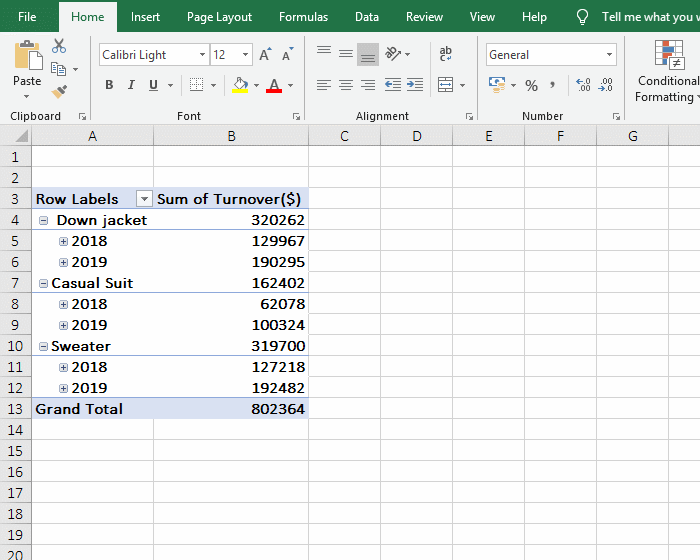
Figure 2
(II) Subtotal by week
1. Change the subtotal by year and month above to the subtotal by week as example. Select one of the cells that contain the years(such as B4), select the "Analysis" tab, click "Group Selection", open the "Grouping" dialog box, and change the "Starting at" from 2018/11/1 to 2018/10/29, click "Years and Months" under "By" to cancel the selection, click "Days" to select it, "Number of days" is changed from gray to optional, change 1 to 7, click "OK", then each piece of clothing is subtotaled by "Week"; the operation steps are as shown in Figure 3:
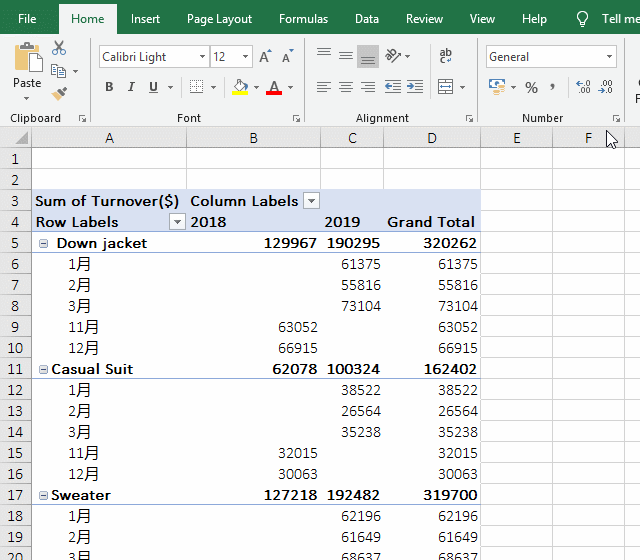
Figure 3
2. "Starting at" is automatically filled in the date 2018/11/1 is the start date of the table, but not Monday, so change it to "Monday" date 2018/10/29, so that you can achieve subtotal by Week.
(III) Sort the results of subtotal
1. The Turnover of different garments is sorted by "Week". Right click on the Turnover of one of the clothes, such as B5, select "Sort → Sort Smallest to Largest" in the pop-up menu, then the weekly Turnover of each garment is sorted in "ascending order"; the operation steps are as shown in Figure 4:
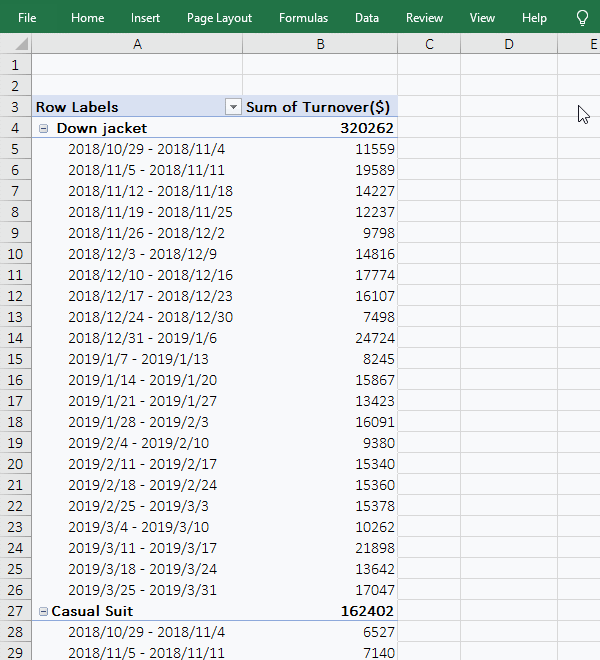
Figure 4
2. Sort the "Turnover" of each garment in "ascending order". Right click on the subtotal for Turnover of any piece of clothing, such as B4, select "Sort → Sort Smallest to Largest" in the pop-up menu, then the "Turnover" of each garment is sorted in ascending order, and the weekly Turnover of each piece of clothing are also sorted; operation process steps, see screenshot in Figure 5:
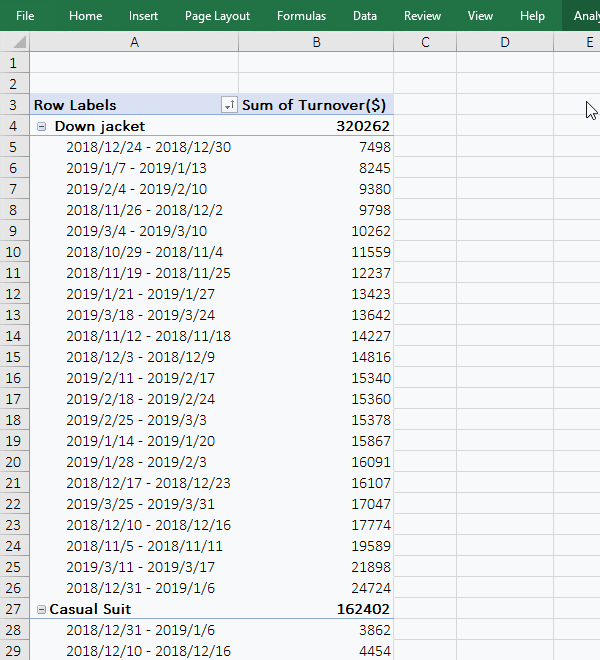
Figure 5
For more information on PivotTable operations, please refer to "How to create a pivot table in excel(15 examples, with distinct count, percentage and four areas)", "How to generate multiple reports from one pivot table(auto create monthly report,hyperlink in excel)" and "Combine multiple excel sheets into one pivot table with multiple consolidation ranges in excel".
II, Subtotal formula in excel(Subtotal with formula)
(I) Excel Subtotal by year
1. If you want to subtotal the annual turnover of various clothing. Double-click the cell F2 and copy the formula =SUM(($A$2:$A$152=F$1)*(YEAR($B$2:$B$152)=$E2)*$C$2:$C$152) to F2, Press Ctrl + Shift + Enter to return to the "Down jacket" Turnover of 129967 in 2018; move the mouse to the cell fill handle in the botttom right of F2, after the mouse changes to the bold black plus sign, hold down the left button and drag to the right , drag to H2, then subtotal the Turnover of the remaining garments in 2018; then move the mouse to the cell fill handle of H2, and drag down in the same method to subtotao the Turnover of various garments in 2019; Operation process steps, see screenshot in Figure 6:
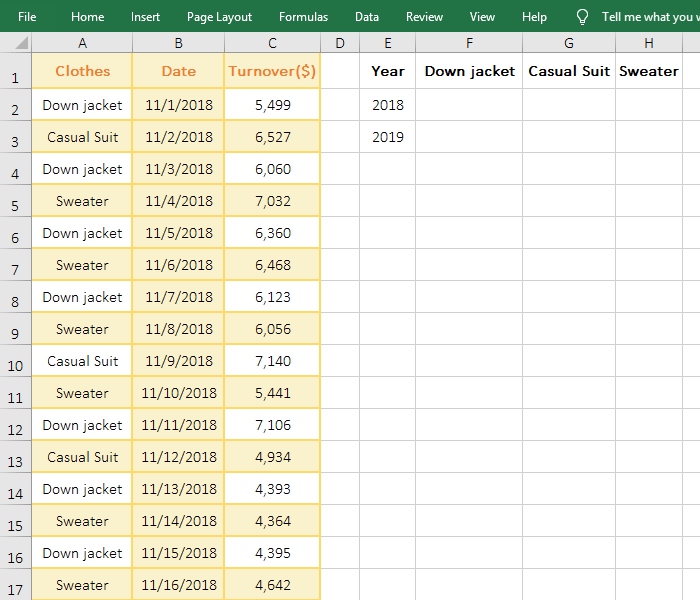
Figure 6
2. Formula =SUM(($A$2:$A$152=F$1)*(YEAR($B$2:$B$152)=$E2)*$C$2:$C$152) description:
A. $A$2 means absolute reference to columns and rows. When dragging to the right, A2 will not become B2, C2, etc.; when dragging down, A2 will not become A3, A4, etc., the other with double $ and $A$2 are a meaning.
B. $A$2:$A$152 returns the "Clothing name" of A2 to A152 as an array. The reason why both A2 and 152 are absolutely referenced is to ensure that when dragging to the right or down, always return to the "Clothing name" in A2:A152.
C. $A$2:$A$152=F$1 is the first criteria of Sum, which means that each "Clothing Name" in A2:A152 is compared with "Down jacket" in F1; if they are equal, it returns True, otherwise return False; take A2 (ie "Down jacket") for the first time, they are equal, return True; take A3(ie "Casual Suit") for the second time, they are not equal, return False; others and so on, and finally return the array {TRUE; FALSE; TRUE;...;TRUE}.
D. $B$2:$B$152 returns the date from B2 to B152 as an array. YEAR($B$2:$B$152) is used to take the year in the date in B2:B152; takes B2(ie 11/1/2018
) for the first time, YEAR(B2) returns 2018; takes B3(ie 11/2/2018) for the second time, YEAR(B3) returns 2018; others and so on, and finally returns {2018; 2018; 2018; ...; 2019}.
E. The value in E2 is 2018, YEAR($B$2:$B$152)=$E2 becomes {2018;2018;2018;...;2019}=2018, and then each element is taken from the array in turn and compared with 2018; returns True if equal, otherwise returns False, and finally returns {TRUE;TRUE;TRUE;...;FALSE}.
F. Then the formula becomes =SUM({TRUE;FALSE;TRUE;...;TRUE}*{TRUE;TRUE;TRUE;...;FALSE}*$C$2:$ C$152), then multiply the corresponding elements in the two arrays; when multiplied, TRUE is converted to 1, FALSE is converted to 0, then the formula becomes =SUM({1;0;1;...;0}*$C$2:$C$152).
G. $C$2:$C$152 is the range to be summed, which returns the Turnover in C2:C152 as an array, which returns {5499;6527;6060;...;6182}.
H. The formula further becomes =SUM({1;0;1;...;0}*{5499;6527;6060;...;6182}), then the corresponding elements of the two arrays are multiplied, and the formula becomes =SUM({5221;0;6060;...;0}), and finally the array is summed, and the result is 129967.
Tip: The formula above can also be implemented with SumIfs, SumProduct and other functions. With these two functions, you don't need to press "Ctrl + Shift + Enter" to evaluate, just press Enter. The reason for pressing Ctrl + Shift + Enter with Sum is that the formula is an array formula. To change the formula above to SumProduct, you can write: =SUMPRODUCT(($A$2:$A$152=F$1)*(YEAR($B$2:$B$152)=$E2)*$C$2: $C$152), change it to SumIfs, see the monthly subtotal below.
(II) Excel subtotal by month
1. If you want to subtotal the monthly Turnover of each garment each year. Double-click the cell G2, copy the formula =SUM(($A$2:$A$152=G$1)*(YEAR($B$2:$B$152)=$E$2)*(MONTH($B$2:$B$152)=$F2)*$C$2:$C$152) to G2, press Ctrl + Shift + Enter to return to the "Down jacket" Turnover in November 2018; returns the Turnover of other garments in November 2018 with dragging to the right, and returns the Turnover of each garment for the remaining months of 2018 with the method of dragging down. Change 2018 in E2 to 2019, change 11 and 12 in F2 and F3 to 1 and 2, respectively, the values in G2:I3 are automatically changed the Tuneover of each garment in January and February of 2019; select G2:I2, returns the Turnover of each garment in March of 2019 with dragging down. the operation steps are as shown in Figure 7:
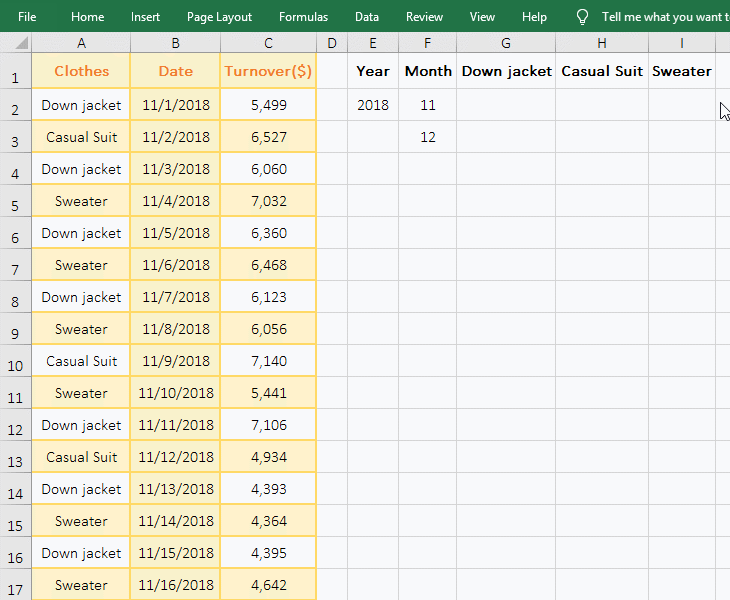
Figure 7
2. Formula =SUM(($A$2:$A$152=G$1)*(YEAR($B$2:$B$152)=$E$2)*(MONTH($B$2:$B$152)=$F2)*$C$2:$C$152) explanation:
The formula and the "subtotal by year" above is a meaning, here is just added a criteria YEAR($B$2:$B$152)=$E$2.
3. The formulas above can also be implemented with the SumIfs and SumProduct functions, which are written as follows:
=SUMPRODUCT(($A$2:$A$152=G$1)*(YEAR($B$2:$B$152)=$E$2)*(MONTH($B$2:$B$152)=$F2)*$C$2:$C$152)
=SUMIFS($C$2:$C$152,$A$2:$A$152,G$1,$B$2:$B$152,">="&DATE($E$2,$F2,0)+1, $B$2:$B$152,"<="&DATE($E$2,$F2+1,0))
These two formulas can be executed directly by pressing Enter. The SumProduct formula and Sum formula are a meaning, no longer parsed, only the SumIfs formula is parsed below:
A. $C$2:$C$152 is the Sum_Range;$A$2:$A$152,G$1 is the first criteria range/criteria pair, $A$2:$A$152 is the criteria range, and G$1 is the criteria. Means: Find the "Down jacket" in G1 in A2:A152.
B. $B$2:$B$152,">="&DATE($E$2,$F2,0)+1 is the second criteria range/criteria pair, it is used to find all dates greater than or equal to 11/1/2018
in B2:B152;
The Year in E2 is 2018, then ">="&DATE($E$2,$F2,0)+1 becomes ">="&DATE(2018,"11",0)+1 , then the Date function converts "11" to a value of 11, and returns the number 43404 indicated on November 0, 2018;
Then ">="&DATE(2018,"11",0)+1 becomes ">="&43404+1, and then ">=" is connected with 43405 with &, ie ">=43405", it is meaning greater than equal to the first day of November, because the 0th day of November 2018 is October 31, 2018, add 1, which happens to be November 1, 2018.
C. $B$2:$B$152,"<="&DATE($E$2,$F2+1,0) is the third criteria range/criteria pair, it is the same as the second criteria range/criteria pair, it is used to find the dates in B2:B152 that are less than or equal to 11/30/2018;
The month in F2 is 11, DATE($E$2,$F2+1,0) becomes DATE(2018,"11"+ 1,0), further calculation becomes DATE(2018,12,0), meaning the 0th day of December 2018, which is November 30, 2018.
D. The formula becomes =SUMIFS($C$2:$C$152,$A$2:$A$152,G$1,$B$2:$B$152,">=2018/11/1",$B$2:$B$152,"<=2018/11/30"), meaning: Subtotal all Turnovers in A2:A152 for "Down jacket" and "Date" greater than or equal to 2018/11/1 and less than or equal to 2018/11/30.
(III) Excel Subtotal by week
1. If you want to subtotal the Turnover of various clothing in November by week. Enter the date 11/1/2018 on the first day of November into the cell E2, double-click F2, copy the formula =WEEKNUM(E$2+7*(ROW(A1)-1),2)-WEEKNUM(--TEXT(E$2,"e-m"),2)+1 to F2, press Enter, return to the first week of November; move the mouse to the cell fill handle in the bottom right of F2, returns the remaining number of weeks in November with the method of dragging down; double-click G2 and copy the formula =SUM((WEEKNUM(--B$2:B$152,2)=WEEKNUM(E$2+7*(ROW(A1)-1),2))*C$2:C$152) to G2, press Ctrl + Shift + Enter to return the Turnover for the first week of November, and also returns the remaining week's Turnover with the method of dragging down; operation process steps, see screenshot in Figure 8:
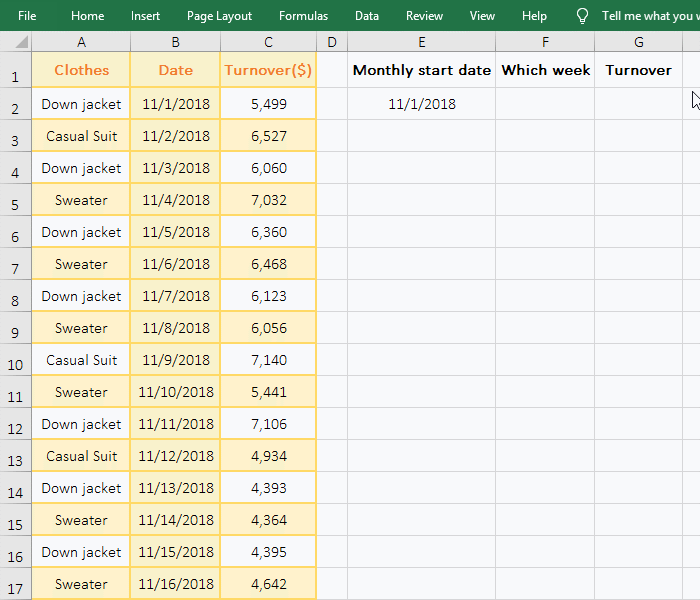
Figure 8
2. Formula description:
(1) =WEEKNUM(E$2+7*(ROW(A1)-1),2)-WEEKNUM(--TEXT(E$2,"e-m"),2)+1
A. ROW(A1) is used to return row number 1 of A1, 7*(ROW (A1)-1 is used to do that you drag down a cell each time, the date is added to the next week; when the formula is in F2, it becomes 7*(1-1)=0, when the formula is at F3, A1 is automatically changeed to A2, ROW(A2) returns 2, it becomes 7*(2-1)=7; others and so on.
B. =WEEKNUM(E$2+7*(ROW(A1)-1),2) is used to return the first few weeks in the year of the specified date, E$2+7*(ROW(A1)-1) is the date, argument 2 means "Monday" as the first day of the week;
Take the formula in F2 as an example: E2 is 11/1/2018, 7*(ROW(A1)-1) returns 0, then =WEEKNUM(E$2+7*(ROW(A1)-1),2) becomes =WEEKNUM(E$2+0,2), which returns 44, that is, 11/1/2018 is the 44th week of the year.
C. e-m means display date by year and month, e means year, equivalent to yyyy; m means month, equivalent mm; position of e and m can be exchanged; TEXT(E$2,"e-m") means returning to 11/1/2018 in E2 by year and month, that is, return "11/2018"; -- in --"11/2018" means to convert the text to a date, which is equivalent to the Value function.
D. Then WEEKNUM(--TEXT(E$2,"e-m"),2) becomesWEEKNUM(--"11/2018",2), and further calculates, returns 44.
E. The formula becomes =44-44+1, further calculation, returns the "first week"; when the formula is in F3, the formula becomes =45-44+ 1, returns the "second week", and so on.
(2) =SUM((WEEKNUM(--B$2:B$152,2)=WEEKNUM(E$2+7*(ROW(A1)-1),2))*C$2:C$152)
A. WEEKNUM(--B$2:B$152,2) is used to return the first few weeks of the dates in B2:B152 in the year as an array; first, take out B2(ie 11/1/2018), WEEKNUM (--B2,2), return 44; second, take out B3(ie 11/2/2018), WEEKNUM(--B3,2), return 44; the other and so on, and finally returns {44;44;44;44;45;...;46}.
B. The WEEKNUM(E$2+7*(ROW(A1)-1) has been explained above. When the formula is in G2, it returns 44; when the formula is in G3, it returns 45.
C. Then the formula becomes =SUM(({44;44;44;44;45;...;46}=44)*C$2:C$152), then compare each element in the array with 44, return True if equal, otherwise return False.
D. The formula becomes =SUM({TRUE;TRUE;TRUE;TRUE;FALSE;...;FALSE}*C$2:C$152), Further calculations, multiplying each value in C2:C152 by the corresponding element in the array, the values ??of TRUE and FALSE when multiplied, which have been explained above.
E. The formula further becomes =SUM({5499;6527;6060;7032;...;0}), and finally sums the array, returns 25118.
F. When the formula is in F3, the formula becomes =SUM(({44;44;44;44;45;...;46}=45 ) *C$2: C$17), which happens to be a return of True for all 45 in the array, which is the sum of the Turnover for the second week.
In addition, the Sum formula can be instead of SumProduct, and the formula can be written like this: =SUMPRODUCT((WEEKNUM(--B$2:B$152,2)=WEEKNUM(E$2+7*(ROW(A1)-1),2))*C$2:C$152).
-
Related Reading
- How to subtotal in excel, with two fields, copy, sor
- Combine multiple excel sheets into one pivot table w
- How to create a pivot table in excel(15 examples, wi
- Excel pivot table percentage of grand total(parent r
- Excel SumProduct function(multiple criteria, with if
- How to generate multiple reports from one pivot tabl
- How to use advanced filter in excel(7 examples, mult
- How to filter in excel(16 examples, with number,text
- How to use Excel subtotal function(combine it with O
- How to sort in excel(11 examples), include sort by c