 Office > Excel > Excel 2019 > Content
How to use Excel frequency function(6 examples, with count number of people in different fractions)
The Frequency function is used to count the frequency of occurrences of values within a range of values and return statistical results as a vertical array in Excel. It does not count the frequency of occurrence of a certain value in a specified interval but counts how many numbers there are in a specified interval.
The typical application of the Frequency function is to count the number of people in different fractions and different age groups. The application is relatively simple and does not need to be combined with other functions. However, to achieve horizontal statistics or continuous occurrence statistics, you need to combine with the Transpose, Max, and Row functions, such as Transpose + Frequency + Row to achieve horizontal statistics.
I, The syntax of the Excel Frequency function
1. Expression: FREQUENCY(Data_Array,Bins_Array)
2. Description:
A. If there is no value in the Data_Array, the Frequency function only returns a zero array. In addition, the Frequency function ignores white space and text.
B. If there is no value in Bins_Array, the Frequency function will return the number of elements in the Data_Array.
C. The Frequency function returns the array with one more element than the Bins_Array, and the extra element is a count greater than the highest interval value, as shown in the example below.
D. If you want the Frequency function to return an array, you must enter it as an array, that is, after inputting the formula, press Ctrl + Shift + Enter. For example, to fill the statistics of different intervals into adjacent cells, after selecting adjacent cells, you need to press Ctrl + Shift + Enter, for details, see the example below.
II, The examples of Excel Frequency function
(I) How to use Frequency function in excel: The Frequency function ignores whitespace and text and the returned array is one more element than the Bins_Array
1. Double-click cell C2, copy the formula =INDEX(FREQUENCY(A2:A6,B2:B3),2) to C2, press Ctrl + Shift + Enter(Excel 2016 and later versions can also press Enter directly), return 2; Hold down Alt, press M and V in turn, open the "Evaluate Formula" window, press Enter to evaluate, then the Frequency function returns the array {1;2;0}; the operation steps, as shown in Figure 1:
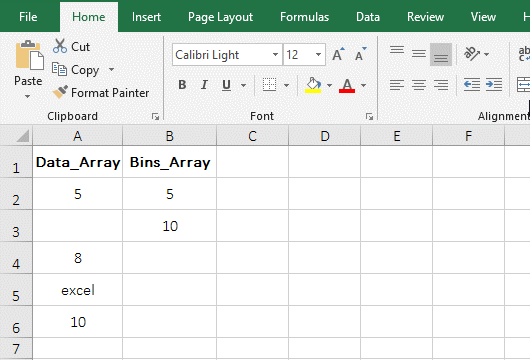
Figure 1
2. The formula =INDEX(FREQUENCY(A2:A6,B2:B3),2) description:
A. A2:A6 is the reference to a range of cells of the Frequency function, which has empty cells and text, but they are ignored; B2:B3 is an interval array, which can be divided into three intervals, the first one is less than or equal to 5, the second is greater than 5 and less than or equal to 10, and the third is greater than 10.
B. When executed,
First, how often values occur within the first interval(ie, less than or equal to 5) is counted in A2:A6, the interval has only one 5, and its frequency of occurrence is 1, so it returns 1.
Second, how often values occur within the second interval(that is, greater than 5 and less than or equal to 10) is counted in A2:A6, the interval has 8 and 10 numbers, and their frequency of occurrence is 1, so 2 is returned(the result returned is the sum of the frequency of each value in the interval).
Third, how often values occur within the third interval(ie, greater than 10) is counted in A2:A6, and since there is no value greater than 10, it returns 0.
C. Then FREQUENCY(A2:A6,B2:B3) finally returns {1;2;0}, the Bins_Array B2:B3 has only two elements, and returns array {1;2;0} has three elements, the last element 0 is the frequency which the value in the third interval (ie, greater than 10) is counted.
D. The formula becomes =INDEX({1;2;0},2), and finally returns the value in the cell at the intersection of the first column and second row in the array by the Index function, that is, returns 2. The reason why the Index function is used here is because the Frequency function cann't return an array if the adjacent cell is not selected.
(II) Count frequency of text in excel
1. Double-click cell A8, copy the formula =FREQUENCY(A2:A7,A2:A7) to A8, press Enter, return 0; the operation steps are as shown in Figure 2:
Figure 2
2. Formula =FREQUENCY(A2:A7,A2:A7) explanation:
The two arguments of the formula are A2:A7. Since the area is all text, and the Frequency function ignores the text, so returns 0.
(III) There are duplicate numbers and fills statistical results of different intervals into adjacent cells.
1. Select C2:C3, enter the equal sign =, then press Ctrl + V to paste the formula FREQUENCY (A2:A7,B2:B3) to the right of =, press Ctrl + Shift + Enter, then the cells selected are filled by Corresponding statistical results; operational process steps, as shown in Figure 3:
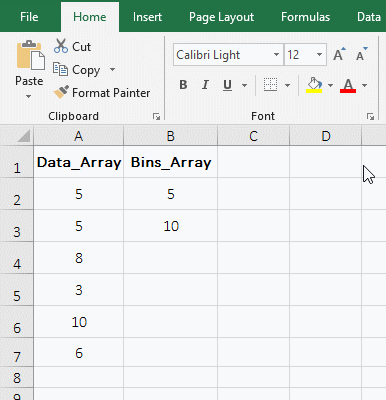
Figure 3
2. Formula description:
A. The result 3 in C2 is the number of values less than or equal to 5 in A2:A7. There are two 5 and one 3 in the interval, which add up to exactly 3 values. It can be seen that the Frequency function counts the number of values in the interval, not the number of a number.
B. The result 8 in C3 is the number of values greater than 5 and less than or equal to 10 in A2:A7. The interval has 6, 8, and 10, which are also three values.
C. Since C2:C3 is also selected at the same time and the formula is filled at the same time, they have already formed a group and cannot be modified or deleted individually. Only they can be modified or deleted when they are selected.
III, The application examples of Excel Frequency function(Excel frequency count)
(I) Count the number of people in different fractions
1. If you want to count the number of students who fail or whose score is in 60-69, 70-79, 80-89, 90-99, and 100 points. Select D2:D7, enter the equal sign =, copy the formula FREQUENCY(B2:B18,C2:C6-1) to the right of =, press Ctrl + Shift + Enter to count the number of students in different score segments; the operational procedure steps, as shown in Figure 4:
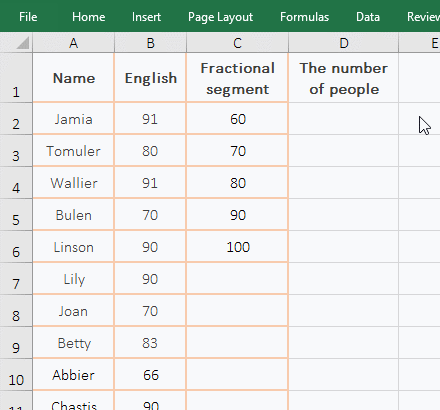
Figure 4
2. Formula =FREQUENCY(B2:B18,C2:C6-1) description:
A. Since it is 60, 70 in C2:C6, and you want to count the number of people who are fail or whose score in 60-69, so use C2:C6-1, subtract 1 from each value in C2:C6 actually. If you do not decrease 1, you can fill in 59, 69, 79, 89, 99 directly in C2:C6.
B. The statistical result 0 in D2 is the number of people who fail, 1 in D3 is the number of people in the 60-69 score segment, 4 in D4 is the number of people in the 70-79 score segment, and 6 in D5 is the 80-89 score segment, 6 in D6 is the number of people in the 90-99 score segment, and 0 in D7 is the number of people of 100 points.
Tip: If you don't count specifically the number of people in 100 points, but instead assign 100 points to score points above 90 points, you can change 100 in C6 to 101. In addition, counting the number of people of different ages is the same method.
(II) Transpose + Frequency + Row combination to achieve horizontal statistical
1. If you want to count the frequency of each digit from 0 to 7 and display the statistical results horizontally. Select A10:H10, enter the equal sign =, copy the formula TRANSPOSE(FREQUENCY(A1:F7,ROW(1:8)-1)) to the right of =, press Ctrl + Shift + Enter to count the frequency of occurrence of each of the numbers 1 to 7 in A1:F7; the operational procedure steps, as shown in Figure 5:
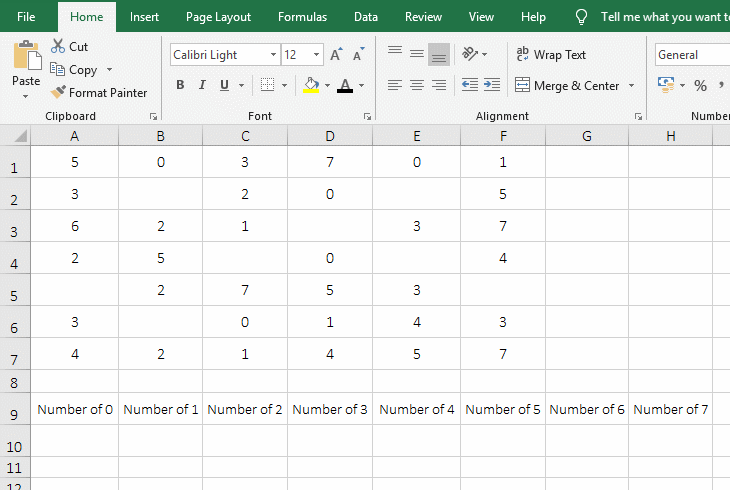
Figure 5
2. Formula =TRANSPOSE(FREQUENCY(A1:F7,ROW(1:8)-1)) description:
A. ROW(1:8)-1 is used to return a number from 0 to 7 as an array, ROW(1:8) returns a number from 1 to 8 as an array, then subtracts 1 from each digit, and returns the number from 0 to 7.
B. The Transpose function converts the result returned by the Frequency function from column to row. If the Transpose function is not used, although A10:H10 is selected at the same time, only the frequency of 0 can be counted.
(III) Max + Frequency + Row combination counts the most consecutive
1. If you want to count the number of months with the most continuous growth. Double-click the cell C2, copy the formula =MAX(FREQUENCY(ROW(1:12),(B2:B13<>1)*ROW(1:12)))-1) to C2, press Enter, return to 4; the process steps are shown in Figure 6:
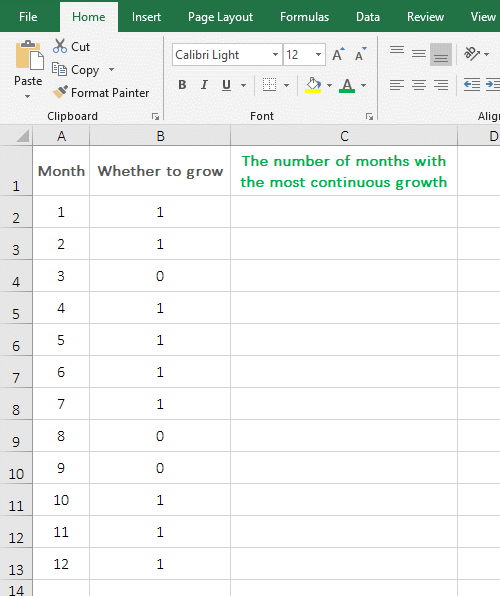
Figure 6
2. Formula =MAX(FREQUENCY(ROW(1:12),(B2:B13<>1)*ROW(1:12)))-1 explanation:
A. ROW(1:12) returns the number from 1 to 12 as an array, ie {1;2;3;4;5;6;7;8;9;10;11;12}.
B. B2:B13 returns all the numbers in B2:B13 as an array, ie {1;1;0;1;1;1;1;0;0;1;1;1}; then B2:B13<> 1 becomes {1;1;0;1;1;1;1;0;0;1;1;1}<>1, then each element is taken from the array and compared with 1, if not equal to 1 returns TRUE , otherwise returns FALSE, then finally returns {FALSE;FALSE;TRUE;FALSE;FALSE;FALSE;FALSE;TRUE;TRUE;FALSE;FALSE;FALSE}.
C. Then (B2:B13<>1)*ROW(1:12) becomes {FALSE;FALSE;TRUE;FALSE;FALSE;FALSE;FALSE;TRUE;TRUE;FALSE;FALSE;FALSE}*{1;2 ;3;4;5;6;7;8;9;10;11;12}, then multiply the corresponding elements in the two arrays (when multiplied, TRUE turns to 1, FALSE turns to 0), then finally {0;0;3;0;0;0;0;8;9;0;0;0} is returned, so that the interval of Frequency is obtained, and the split point of each interval is exactly the value of 0 in B2:B13.
D. Then the formula becomes =MAX(FREQUENCY({1;2;3;4;5;6;7;8;9;10;11;12}, {0;0;3;0;0;0; 0;8;9;0;0;0}))-1, further calculation, the number of digits greater than 0 and less than or equal to 3, or greater than 3 and less than or equal to 8, greater than 8 and less than or equal to 9, or greater than 9 are counted in the first array, the result is {0;0;3;0;0;0;0;5;1;0;0;0;3}.
E. Then the formula becomes =MAX({0;0;3;0;0;0;0;5;1;0;0;0;3})-1, and then Max is used to maximize the elements in the array, the result is 5, 5-1 is equal to 4. The reason why it is decremented by 1 is because the number of digits in each interval is counted by the Frequency function, and the counted result contain the number that correspond to 0 in B2:B13. For example, the counted result of the interval where the numbers are greater than or equal to 0 and less than 3 contains 3, and 3 corresponds to 0 in B4.
In addition, the Sum + If + Frequency combination can also rank without skipping numbers. For details, please refer to the article "How to use Excel rank function(11 examples, with Rank.EQ and Rank.AVG, without skipping numbers)".
-
Related Reading
- Excel Search function and SearchB usage(13 examples,
- How to move rows,columns,cells,table in excel(there
- Excel CountA and CountBlank function usage examples(
- How to use offset function in excel, include it and
- How to use Excel small function and it and index, ma
- Excel Countifs formula examples, include with And, O
- How to adjust row height and change width of column
- How to use count function in excel, include count re
- How to use excel Index function, include it and Matc
- How to sort in excel(11 examples), include sort by c
- Excel row function examples, with Rows, Row(A:A), Ro
- Excel CountIf usage, include greater than or equal a